Examining Links Between Macroeconomic Trends and Daily Fantasy Sports Involvement Levels
Blake Schmitt · Nov 8, 2026
Examining Links Between Macroeconomic Trends and Daily Fantasy Sports Involvement Levels
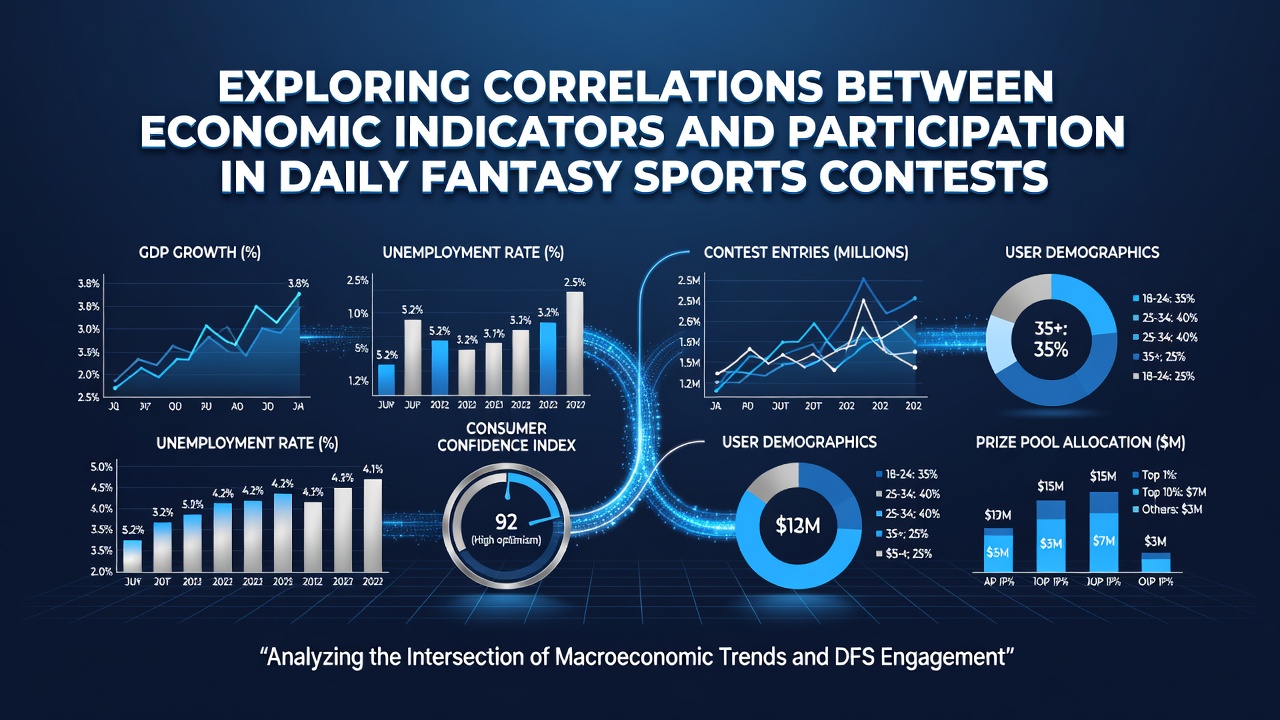
Economic indicators including unemployment figures, consumer confidence indexes, and stock market performance have displayed measurable connections to participation volumes in daily fantasy sports contests across multiple markets, with researchers tracking these patterns through aggregated platform data and public economic releases. Studies from academic institutions and industry analysts have compiled datasets that span several years, revealing how shifts in disposable income metrics often align with changes in contest entry numbers during periods of both expansion and contraction.
Data from the U.S. Bureau of Labor Statistics on employment trends combined with platform-reported active user counts shows that periods of rising unemployment frequently correspond to increased contest volume in lower-stakes formats while higher-stakes entries decline. Observers note that these patterns hold across different regions where daily fantasy sports operate under regulated frameworks, and analysts have cross-referenced the figures with quarterly GDP adjustments to identify consistent directional movements rather than isolated spikes.
Key Indicators Under Review
Consumer spending reports from government agencies in North America and parts of Europe provide another layer of correlation data, where reductions in discretionary outlays during inflationary periods coincide with stabilized or slightly reduced participation in daily fantasy sports. Researchers at various universities have modeled these relationships using regression analyses that incorporate variables such as average household income, retail sales volumes, and credit card utilization rates, producing outputs that highlight moderate but statistically significant associations in most examined quarters.
Stock market volatility tracked through major indices also appears in several datasets, with sharp market downturns sometimes preceding temporary upticks in free-to-play or low-entry contests as participants seek engagement without substantial financial commitment. Figures released through industry trade groups indicate that these behavioral adjustments occur within weeks of major index movements, allowing platforms to adjust promotional structures accordingly while maintaining overall user retention levels.
Regional Patterns and Data Comparisons
Participation trends in markets such as Australia and Canada reveal similar alignments with local economic releases, where employment data from Statistics Canada and comparable agencies in Oceania show that employment stability often supports steady contest volumes across skill-based prediction platforms. Analysts have examined synchronization points between supply chain disruptions noted in global trade reports and fluctuations in user activity, finding that broader economic uncertainty tends to channel activity toward shorter-duration contests rather than season-long commitments.
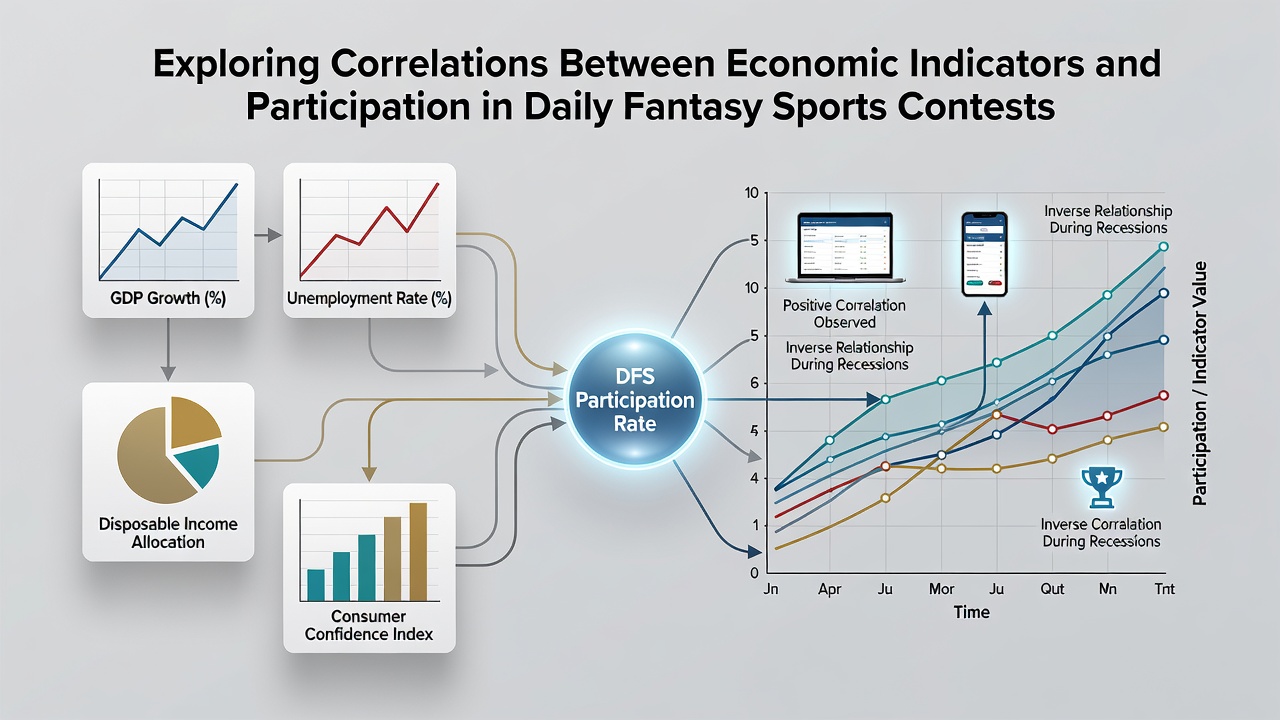
One study released in late 2025 tracked these variables through the first three quarters of 2026, documenting how participation metrics responded to successive interest rate decisions by central banks in multiple jurisdictions. The analysis incorporated platform-level entry data alongside official economic calendars, demonstrating that contest volumes adjusted within defined windows following each policy announcement without requiring direct causation claims.
Platform Adjustments and Market Responses
Daily fantasy sports operators have responded to these observed correlations by refining contest structures and entry thresholds, with some platforms introducing more micro-stakes options during quarters when economic releases signaled potential contraction. Reports from trade associations covering the sector note that such adaptations maintained user engagement levels even as broader economic indicators moved through cycles of growth and slowdown, particularly evident in data extending into November 2026.
Academic papers published through research centers have further broken down demographic segments within the participant base, showing that certain age cohorts and income brackets exhibit stronger responsiveness to shifts in retail sales figures and wage growth statistics. These segmented findings allow for more precise mapping of how macroeconomic signals translate into contest selection preferences across different user groups.
Conclusion
Available datasets continue to support ongoing examination of these correlations, with new economic releases and platform metrics expected to refine existing models through the remainder of 2026 and beyond. Government statistical agencies alongside independent research groups maintain public repositories that facilitate continued analysis, providing updated figures on both economic conditions and sector activity for future comparative work.